Blog entries
Real time abstract art generation using a neural net
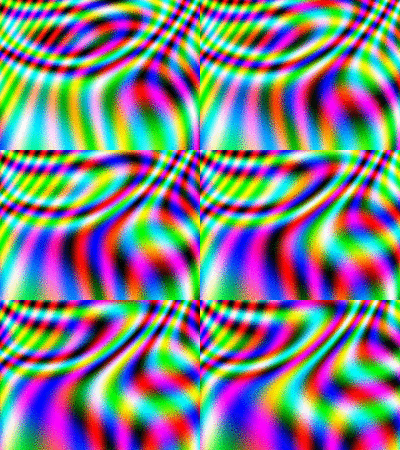
A simple artificial neural net can be leveraged to produce a variety of visually appealing abstract patterns. For a static image, all that's needed is a random mapping from pixel coordinates to RGB values. Add a cyclical temporal input, and you'll have evolving patterns. For interactivity, just add mouse coordinates as inputs.
Vector Transformation Visualization Tool (vtvt) — another demo
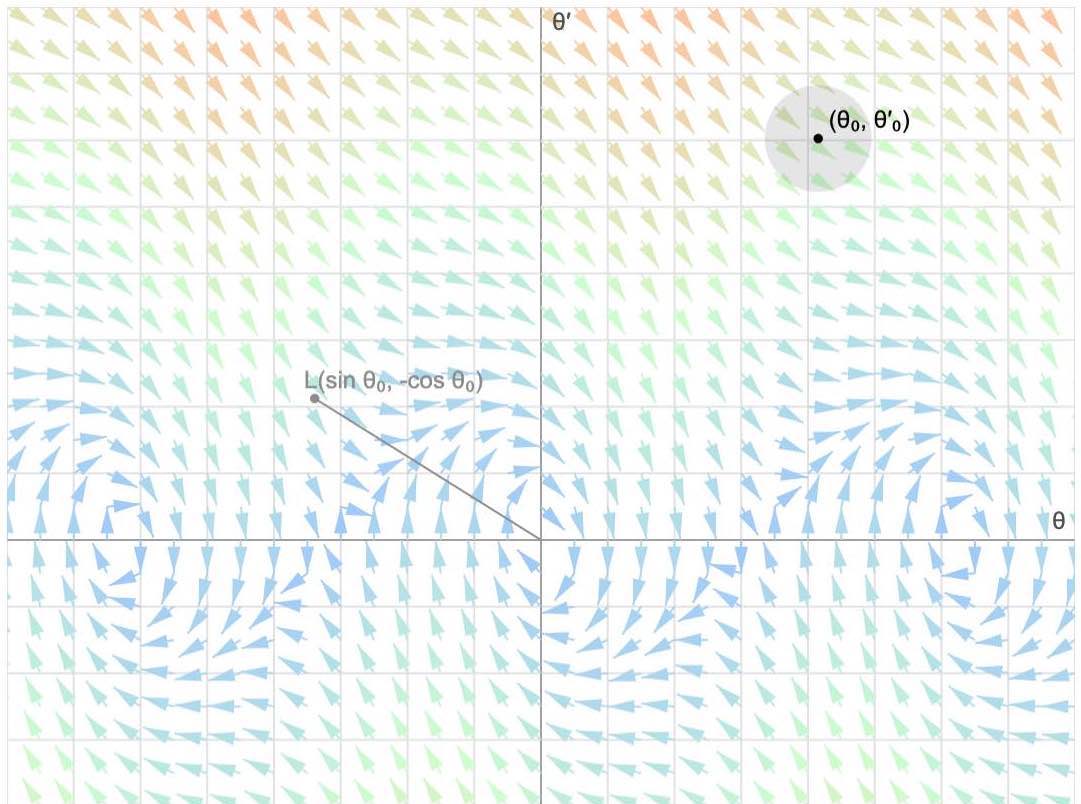
Visualisation of numerical solutions of the pendulum equation by 3blue1brown
Follow-up on "How random can you be?"

I have collected thousands of outcomes and used them to evaluate the performance of the guesser.
How random can you be?

Suppose I asked you to generate a random sequence of ones and zeroes. Every time you add another 1 or 0 to the sequence, I am going to predict your next choice. Do you think you can make your sequence random enough that I fail to guess more than ~50% correct? Read this post to find out. Spoiler — you are not so random.
Covariance matrix and principal component analysis — an intuitive linear algebra approach
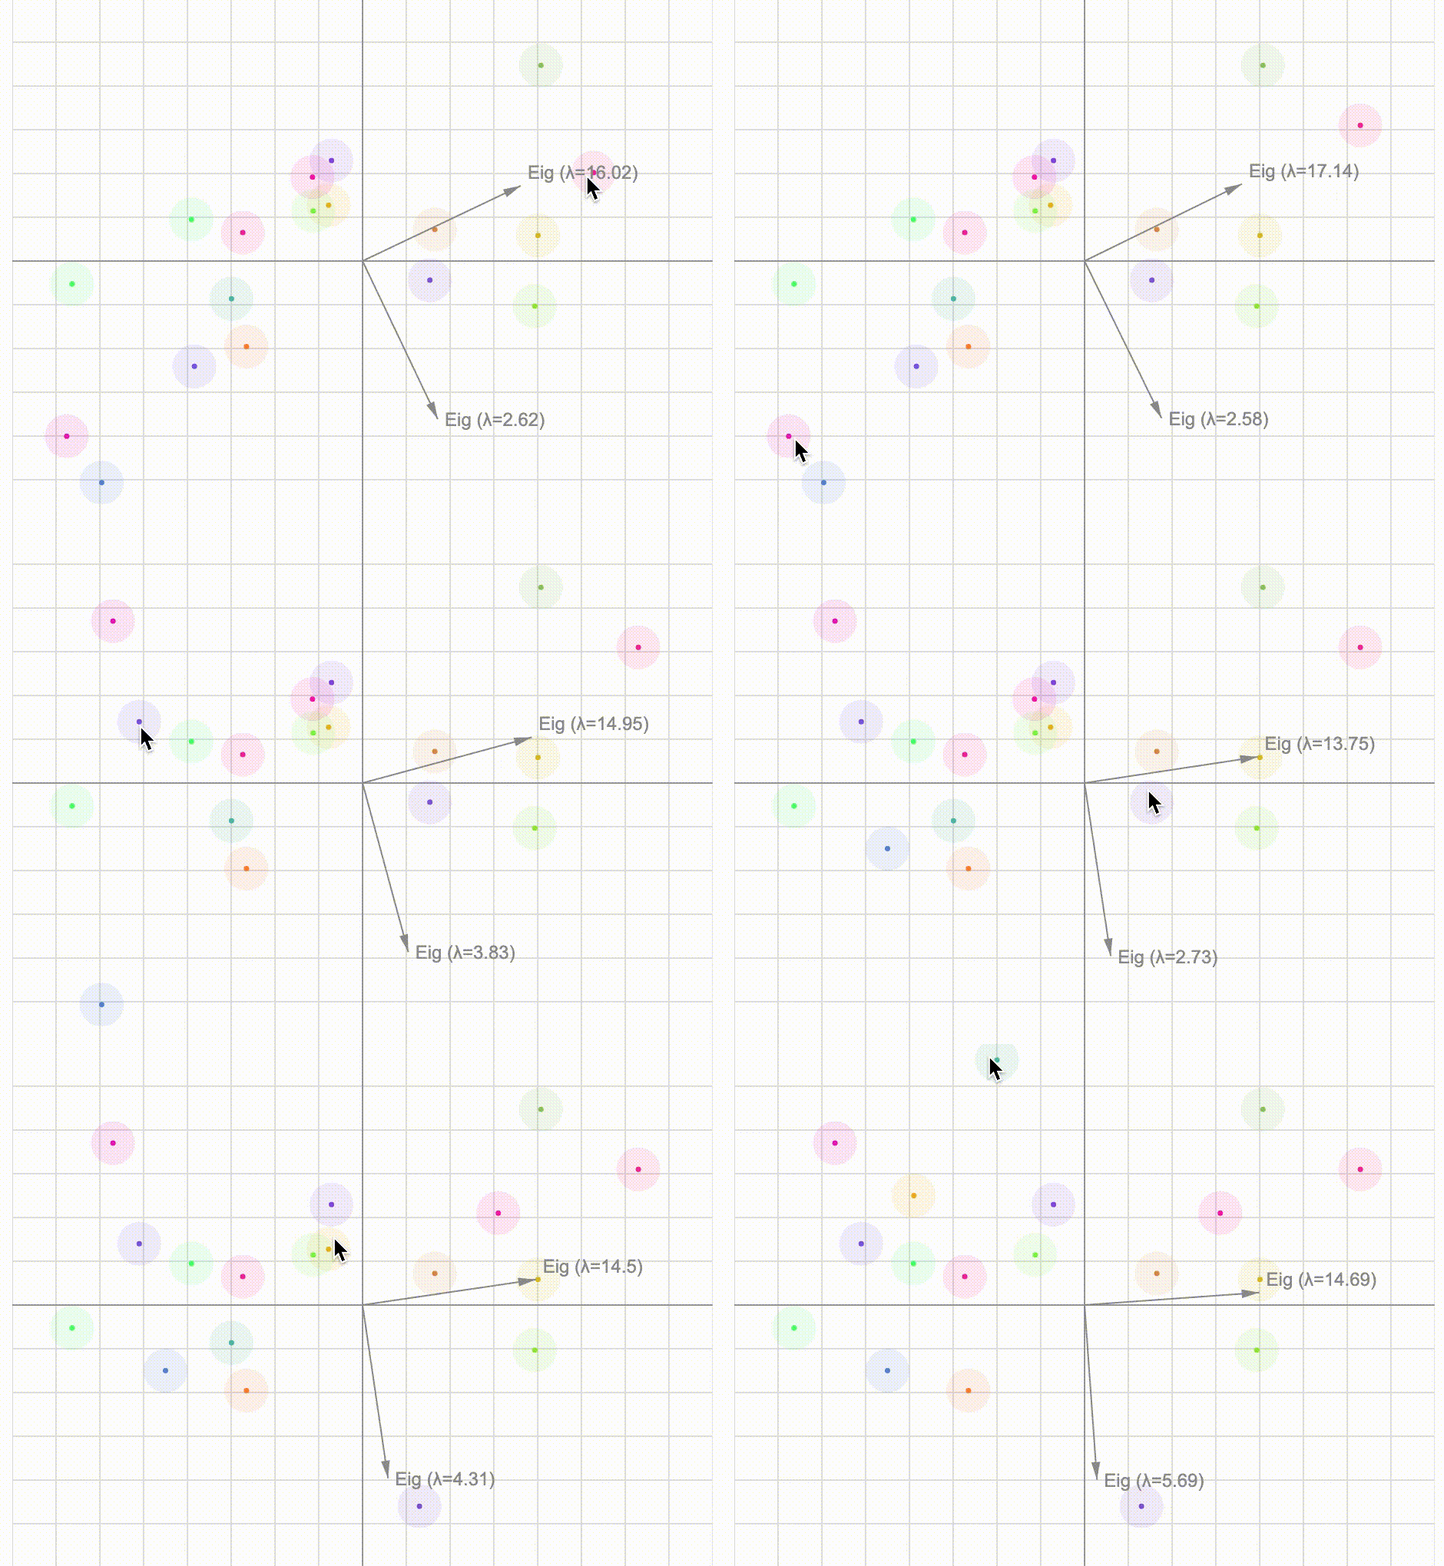
Let's take a close look at the covariance matrix using basic (unrigorous) linear algebra and investigate the connection between its eigen-vectors and a particular rotation tranformation. We can then have fun with an interactive visualisation of principal component analysis.
The real reason you use the MSE and cross-entropy loss functions

If you learned machine learning from MOOCs, there's a good chance you haven't been taught the true significance of the mean squared error and cross-entropy loss functions.
Power iteration algorithm — a visualization
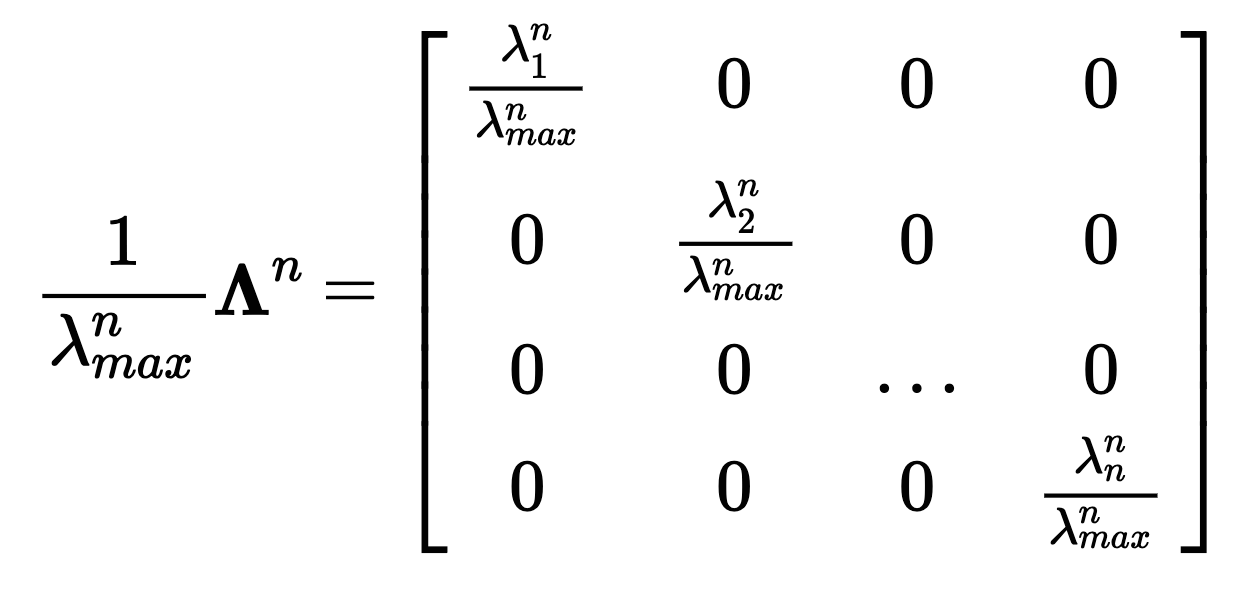
The power method is a simple iterative algorithm used to find eigenvectors of a matrix. I used vtvt to create a visualization of this algorithm.
Vector Transformation Visualization Tool (vtvt) — an online demo
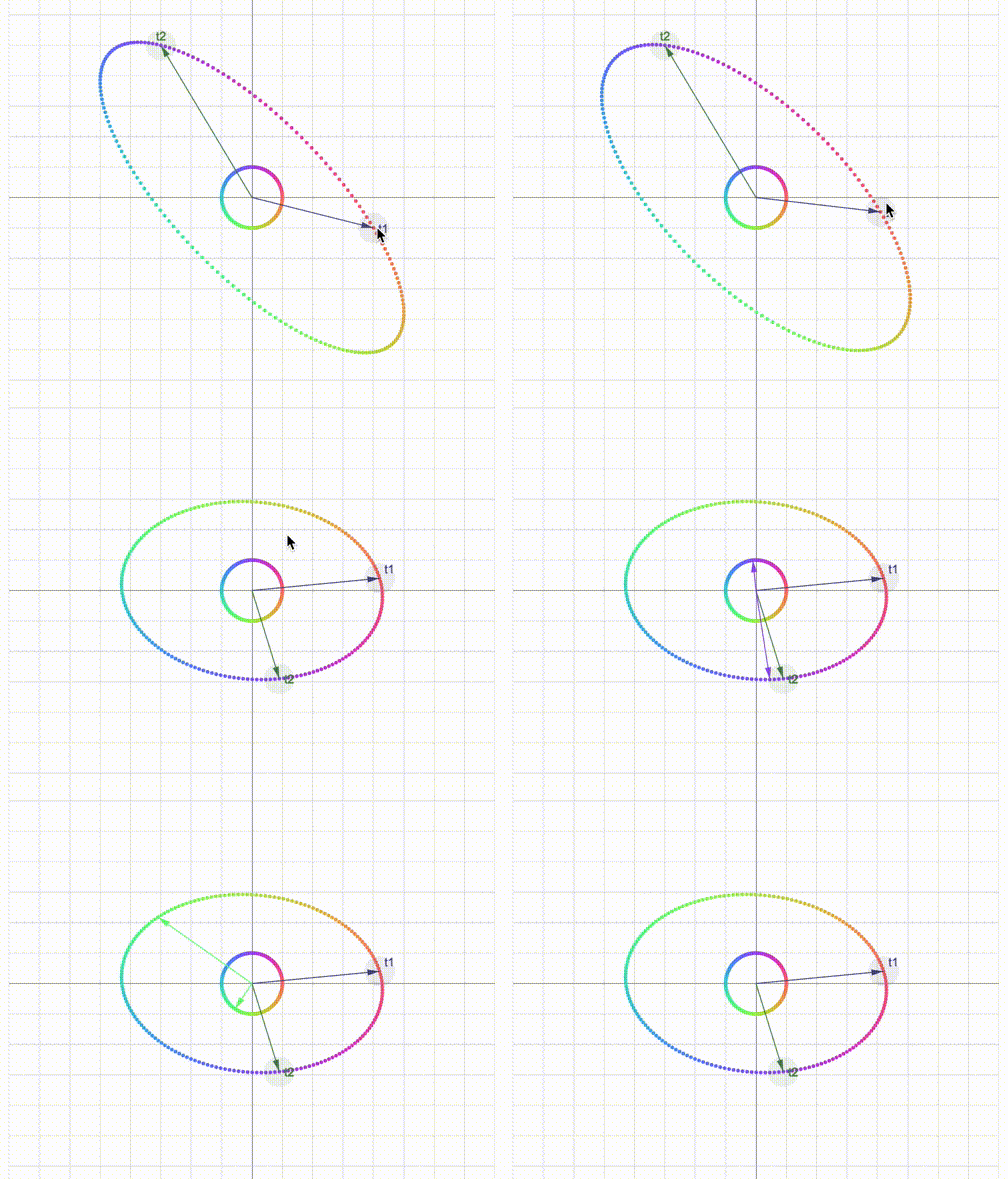
I just finished writing vtvt, a JavaScript library. It's an interactive tool for visualizing vectors and their transformations in R2
Popularity of car colours in the Greater Toronto Area

According to a survey conducted in 2012 by PPG Industries, white (21%) and black (19%) were the two most popular colours in North America followed closely by silver and grey (16% each). Red and blue accounted for 10 and 8% respectively. I decided to test this data by taking photographs of an intersection in Mississauga, Ontario and analyzing them with the help of YOLOv3 as well as OpenCV and scikit-learn libraries.
A battle for net neutrality in Canada — analysis of popular opposition to an application to disable on-line access to piracy sites
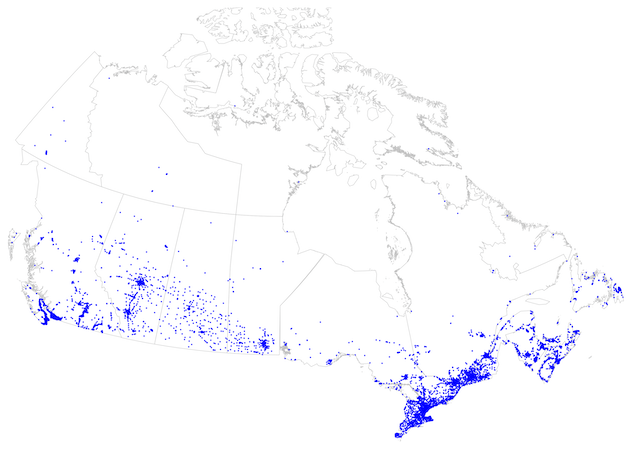
A coalition of organizations involved in production and distribution of digital content in Canada has proposed to create an agency endowed with the right to disable access to internet resources deemed pirated. An application was filed with the Canadian Radio-television and Telecommunications Commission. The CRTC collected public comments ("interventions") and made them available online.
Visualization of E, V, B fields
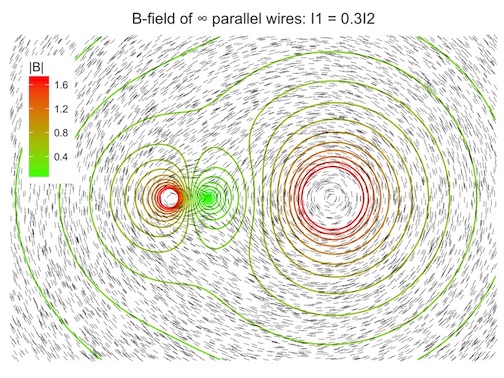
Most physics textbooks illustrate electric and magnetic fields with field lines which are sets of parametrized curves with tangents defined by field vectors. Field lines are great for emphasizing the directional nature of E and B fields, however they fail to convey the magnitude of forces acting on charges by such fields. One way to overcome this issue is to add level curves indicating vector magnitude.
Relationship between random n-vectors at various n

Covariance and Pearson's correlation coefficient are two cornerstone measures of linear dependence in statistics. Both have geometrical interpretations. Sample covariance of variables is the dot product of two n-vectors whose components are formed from centred observations for each variable, scaled by the reciprocal of n-1. Correlation coefficient is the cosine of the angle between the two vectors. Their distributions depend on n. Here we will take a look at distributions of sample covariance, correlation coefficient as well as dot product, angle cosine, and angle between independent vectors with n ∈ {2, 3, 5, 10, 30} components ~N(0,1).
Who gets to be a member of Amazon Vine?

Amazon Vine is a program that matches companies/sellers with select reviewers among Amazon customers. Membership is given by invitation only. According to Amazon, reviewers are selected based on the helpfulness of their reviews, but the exact criteria are not revealed to the public. I decided to investigate what it takes to get an invitation to Amazon Vine by analyzing the publicly available data for the top 10,000 reviewers...
Is Toronto getting warmer these days?
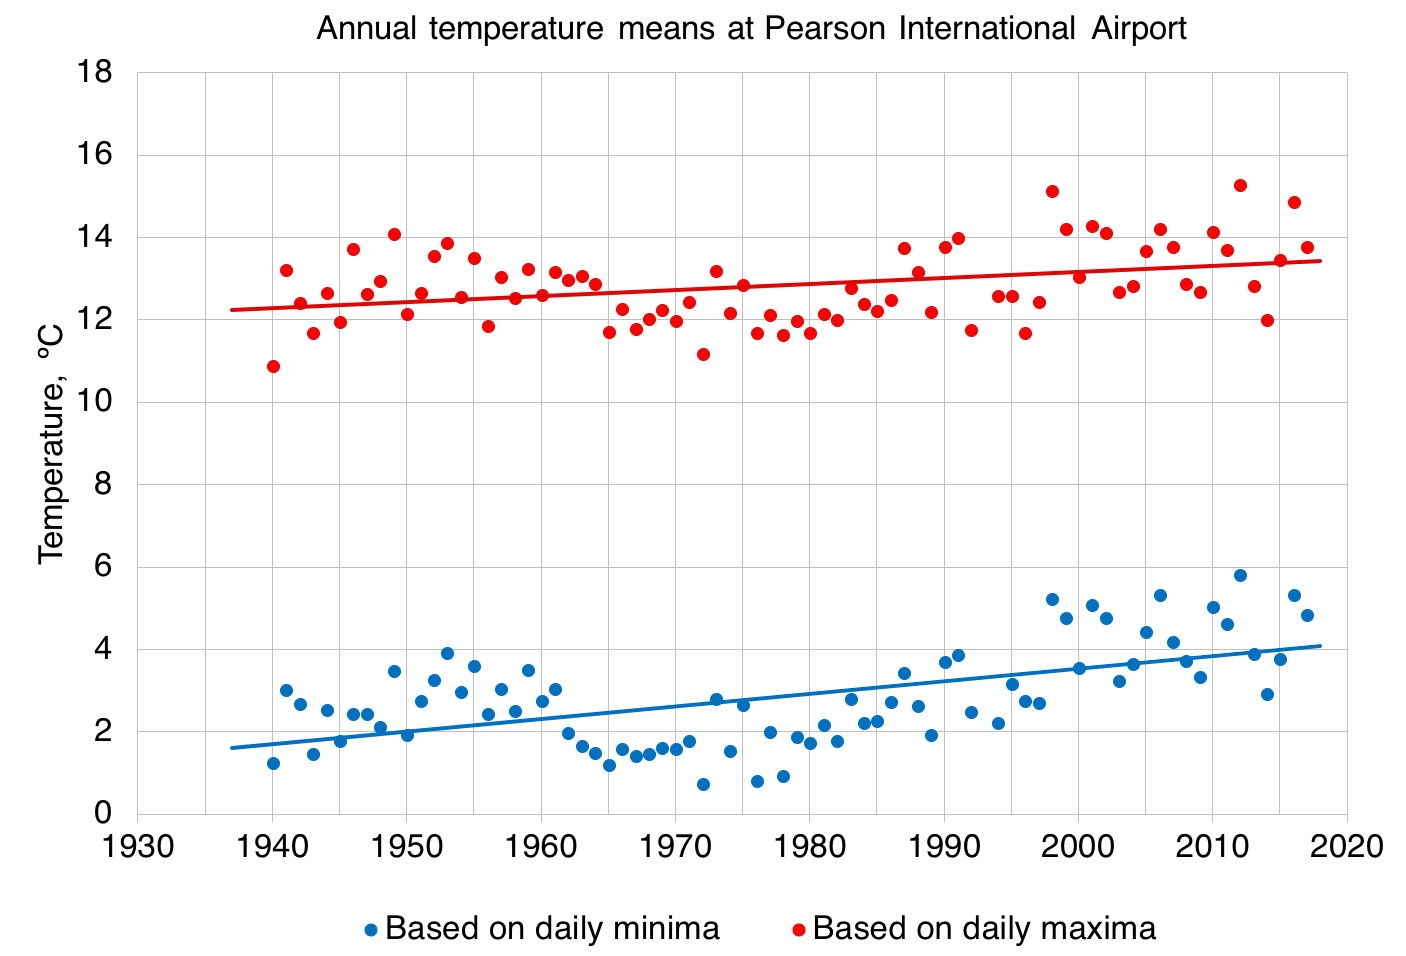
Toronto residents like to complain about weather. For some, Toronto winters are too cold. For others, Toronto summers are too hot. Older people say it used to be colder in general. Who's right and who's wrong? Let's find out the answer using factual data.
Analysis of submissions to /r/dataisbeautiful

Browsing reddit is a popular pastime for many people. Besides being an endless supply of entertainment, reddit is also a source of inspiration — especially /r/dataisbeautiful, a community of visual connoisseurs. Let's see if we can learn anything by analyzing 4716 submissions made over approximately 4 months.