Blog entries
Real time abstract art generation using a neural net
A simple artificial neural net can be leveraged to produce a variety of visually appealing abstract patterns. For a static image, all that's needed is a random mapping from pixel coordinates to RGB values. Add a cyclical temporal input, and you'll have evolving patterns. For interactivity, just add mouse coordinates as inputs.
Vector Transformation Visualization Tool (vtvt) — another demo
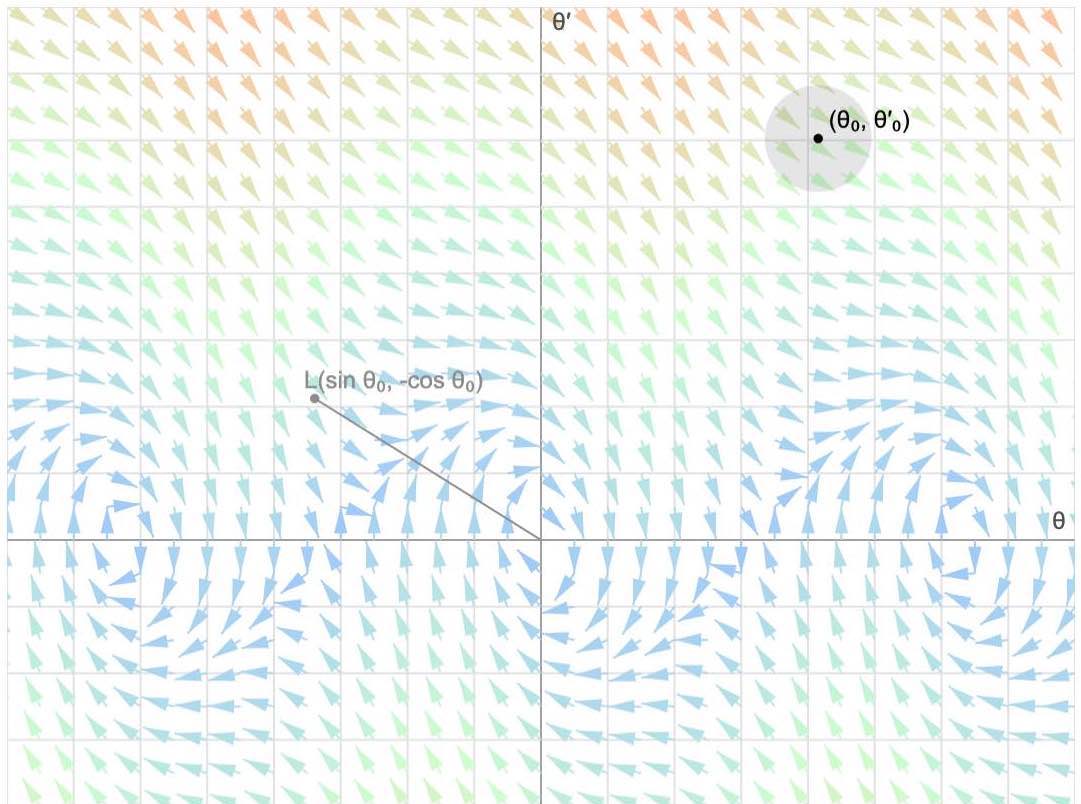
Visualisation of numerical solutions of the pendulum equation by 3blue1brown
How random can you be?
Suppose I asked you to generate a random sequence of ones and zeroes. Every time you add another 1 or 0 to the sequence, I am going to predict your next choice. Do you think you can make your sequence random enough that I fail to guess more than ~50% correct? Read this post to find out. Spoiler — you are not so random.
Covariance matrix and principal component analysis — an intuitive linear algebra approach
Let's take a close look at the covariance matrix using basic (unrigorous) linear algebra and investigate the connection between its eigen-vectors and a particular rotation tranformation. We can then have fun with an interactive visualisation of principal component analysis.
Power iteration algorithm — a visualization
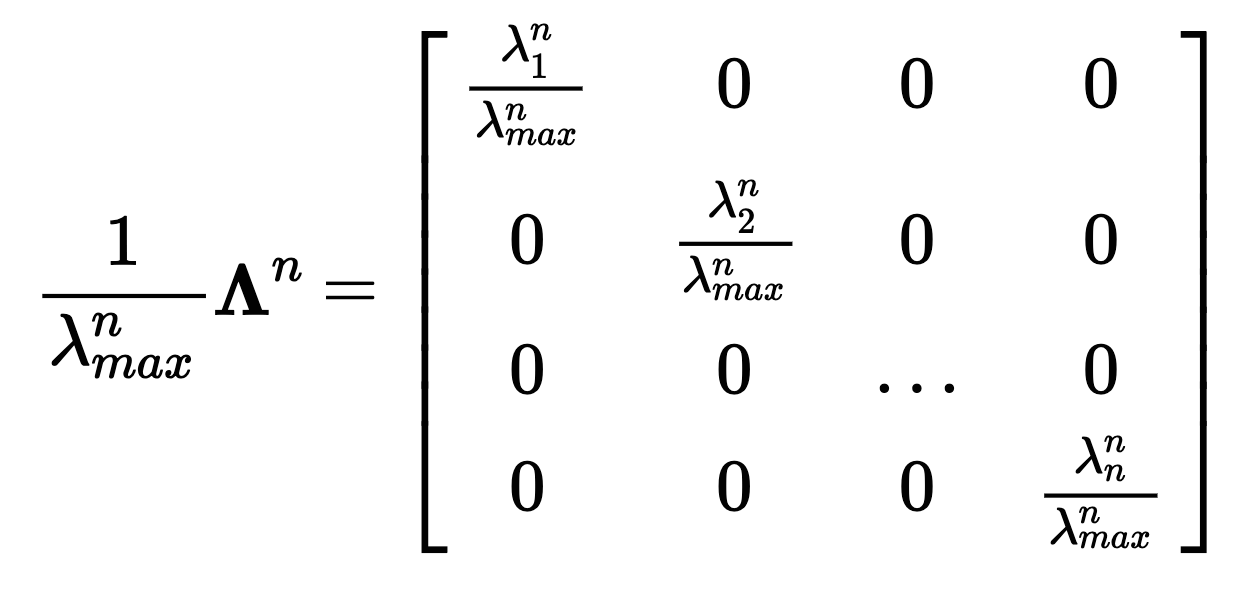
The power method is a simple iterative algorithm used to find eigenvectors of a matrix. I used vtvt to create a visualization of this algorithm.
Vector Transformation Visualization Tool (vtvt) — an online demo
I just finished writing vtvt, a JavaScript library. It's an interactive tool for visualizing vectors and their transformations in R2
Popularity of car colours in the Greater Toronto Area

According to a survey conducted in 2012 by PPG Industries, white (21%) and black (19%) were the two most popular colours in North America followed closely by silver and grey (16% each). Red and blue accounted for 10 and 8% respectively. I decided to test this data by taking photographs of an intersection in Mississauga, Ontario and analyzing them with the help of YOLOv3 as well as OpenCV and scikit-learn libraries.
Visualization of E, V, B fields
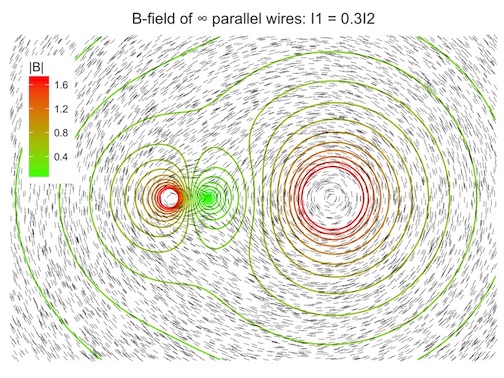
Most physics textbooks illustrate electric and magnetic fields with field lines which are sets of parametrized curves with tangents defined by field vectors. Field lines are great for emphasizing the directional nature of E and B fields, however they fail to convey the magnitude of forces acting on charges by such fields. One way to overcome this issue is to add level curves indicating vector magnitude.