Blog entries
Covariance matrix and principal component analysis — an intuitive linear algebra approach

Let's take a close look at the covariance matrix using basic (unrigorous) linear algebra and investigate the connection between its eigen-vectors and a particular rotation tranformation. We can then have fun with an interactive visualisation of principal component analysis.
The real reason you use the MSE and cross-entropy loss functions

If you learned machine learning from MOOCs, there's a good chance you haven't been taught the true significance of the mean squared error and cross-entropy loss functions.
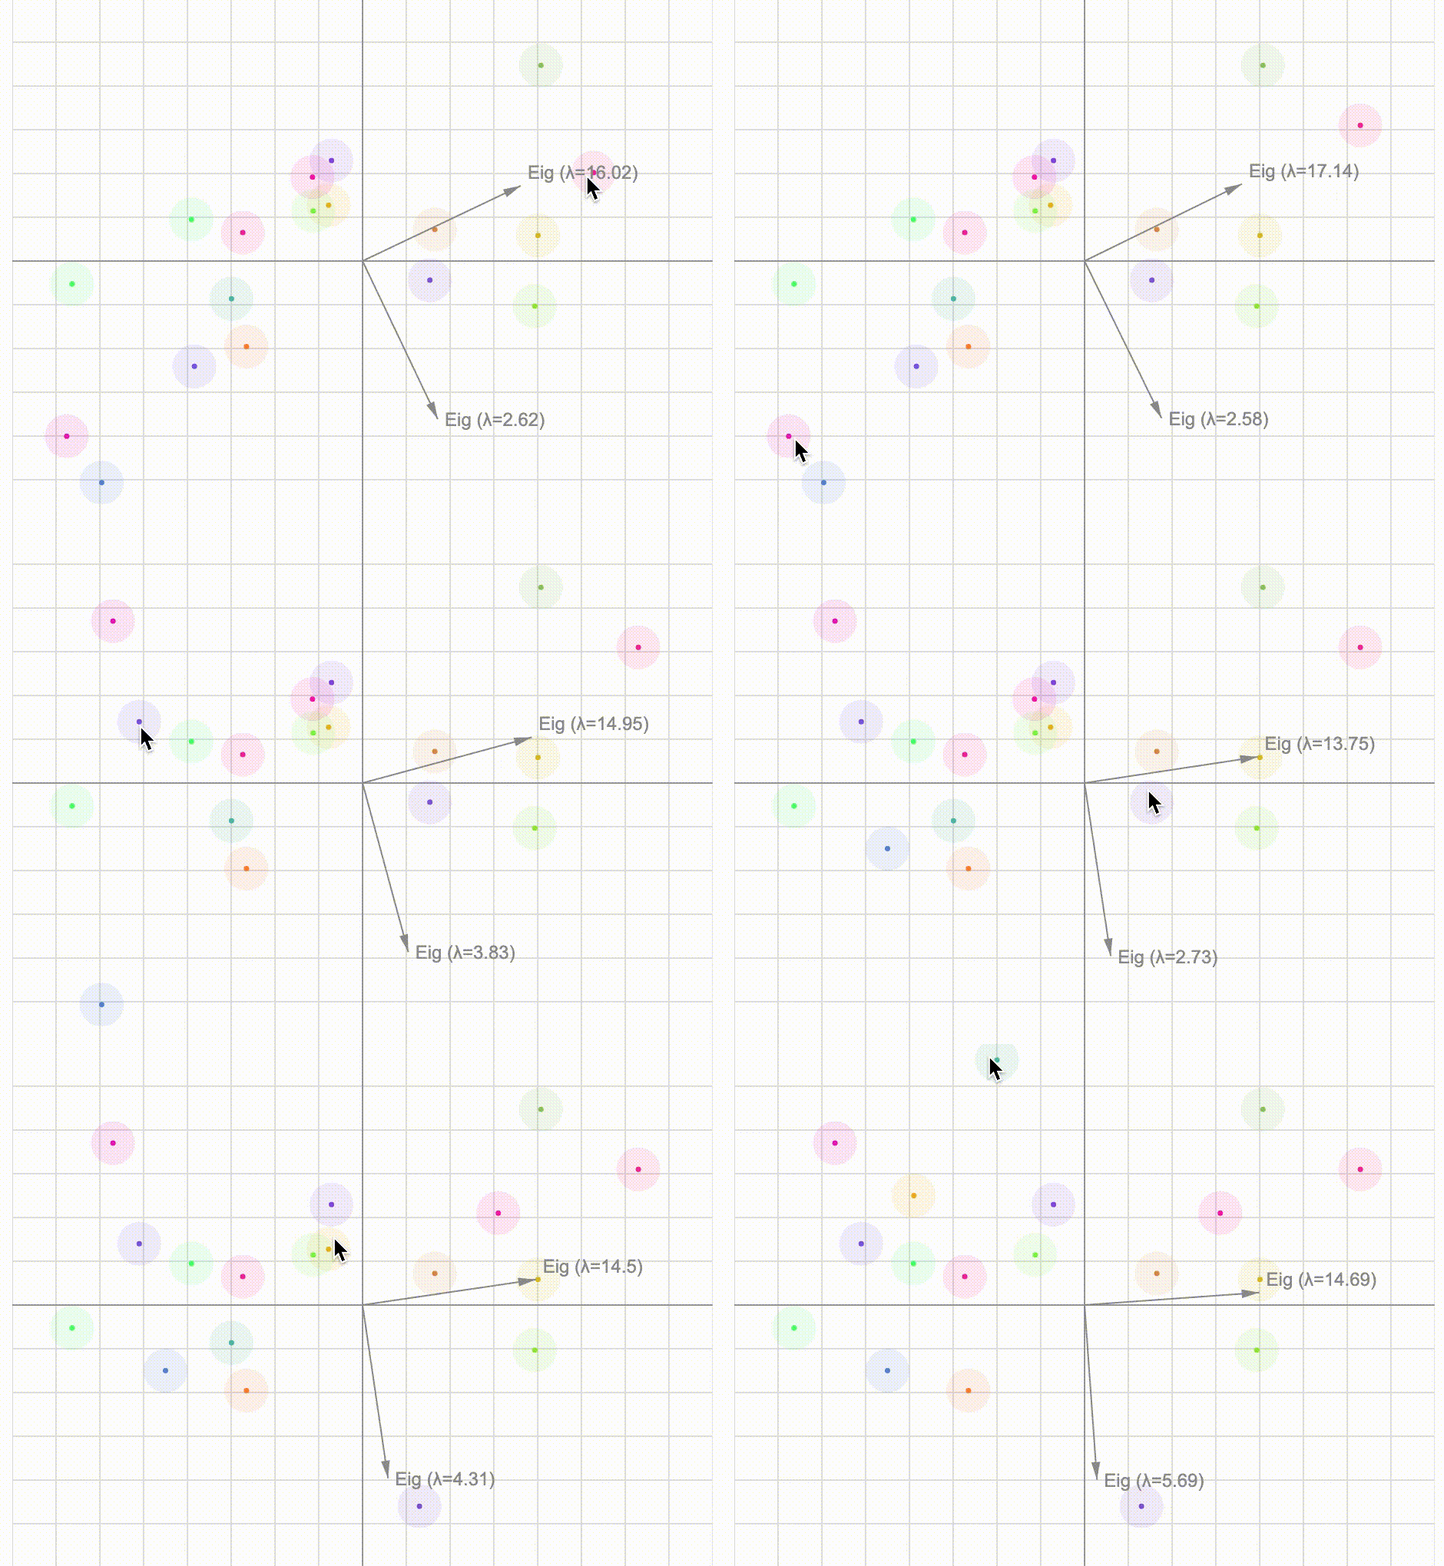
Power iteration algorithm — a visualization

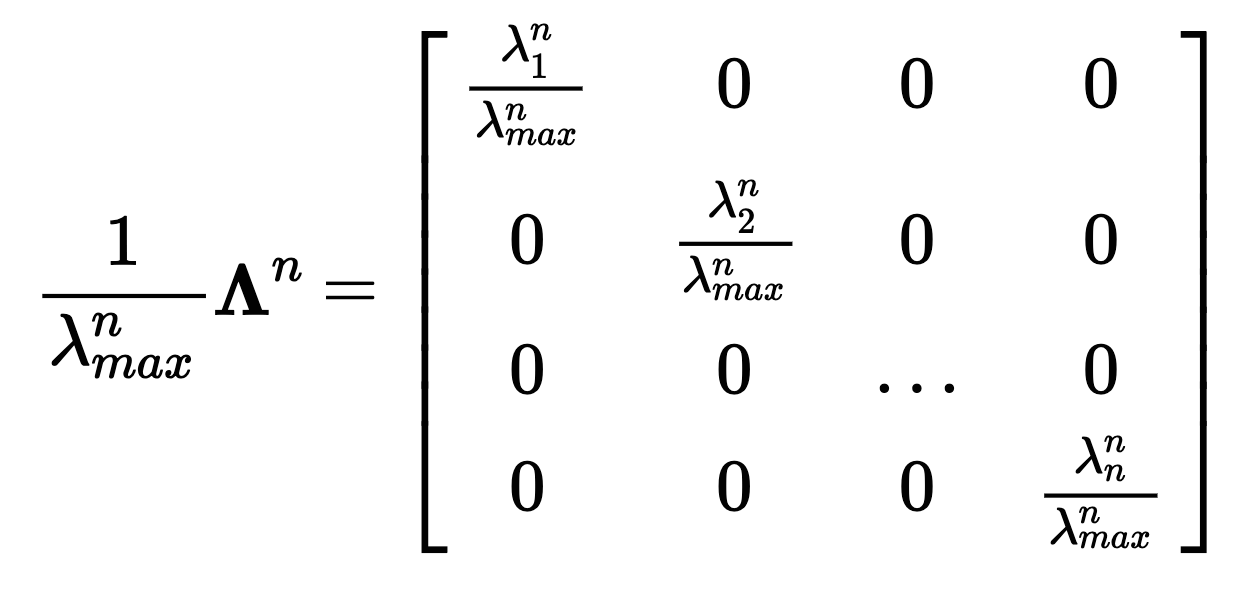
The power method is a simple iterative algorithm used to find eigenvectors of a matrix. I used vtvt to create a visualization of this algorithm.
Relationship between random n-vectors at various n

Covariance and Pearson's correlation coefficient are two cornerstone measures of linear dependence in statistics. Both have geometrical interpretations. Sample covariance of variables is the dot product of two n-vectors whose components are formed from centred observations for each variable, scaled by the reciprocal of n-1. Correlation coefficient is the cosine of the angle between the two vectors. Their distributions depend on n. Here we will take a look at distributions of sample covariance, correlation coefficient as well as dot product, angle cosine, and angle between independent vectors with n ∈ {2, 3, 5, 10, 30} components ~N(0,1).