May 01, 2018 tags: | exploratory analysis |
Is Toronto getting warmer these days?
Toronto residents like to complain about weather. For some, Toronto winters are too cold. For others, Toronto summers are too hot. Older people say it used to be colder in general. Who’s right and who’s wrong? Let’s find out the answer using factual data.
The Government of Canada makes historical weather station data available to the public via http://climate.weather.gc.ca. E.g., the following url submits a GET request for a csv file with daily data for Pearson International airport in 2018: http://climate.weather.gc.ca/climate_data/bulk_data_e.html?format=csv&stationID=51459&Year=2018&timeframe=2&submit=Download+Data. Using this resource, I’ve compiled and plotted the data for the past 60 years.
Monthly means of daily temperatures by year
I took the daily minimum and maximum temperatures and averaged them for January, April, July and October (representing each of the four seasons).
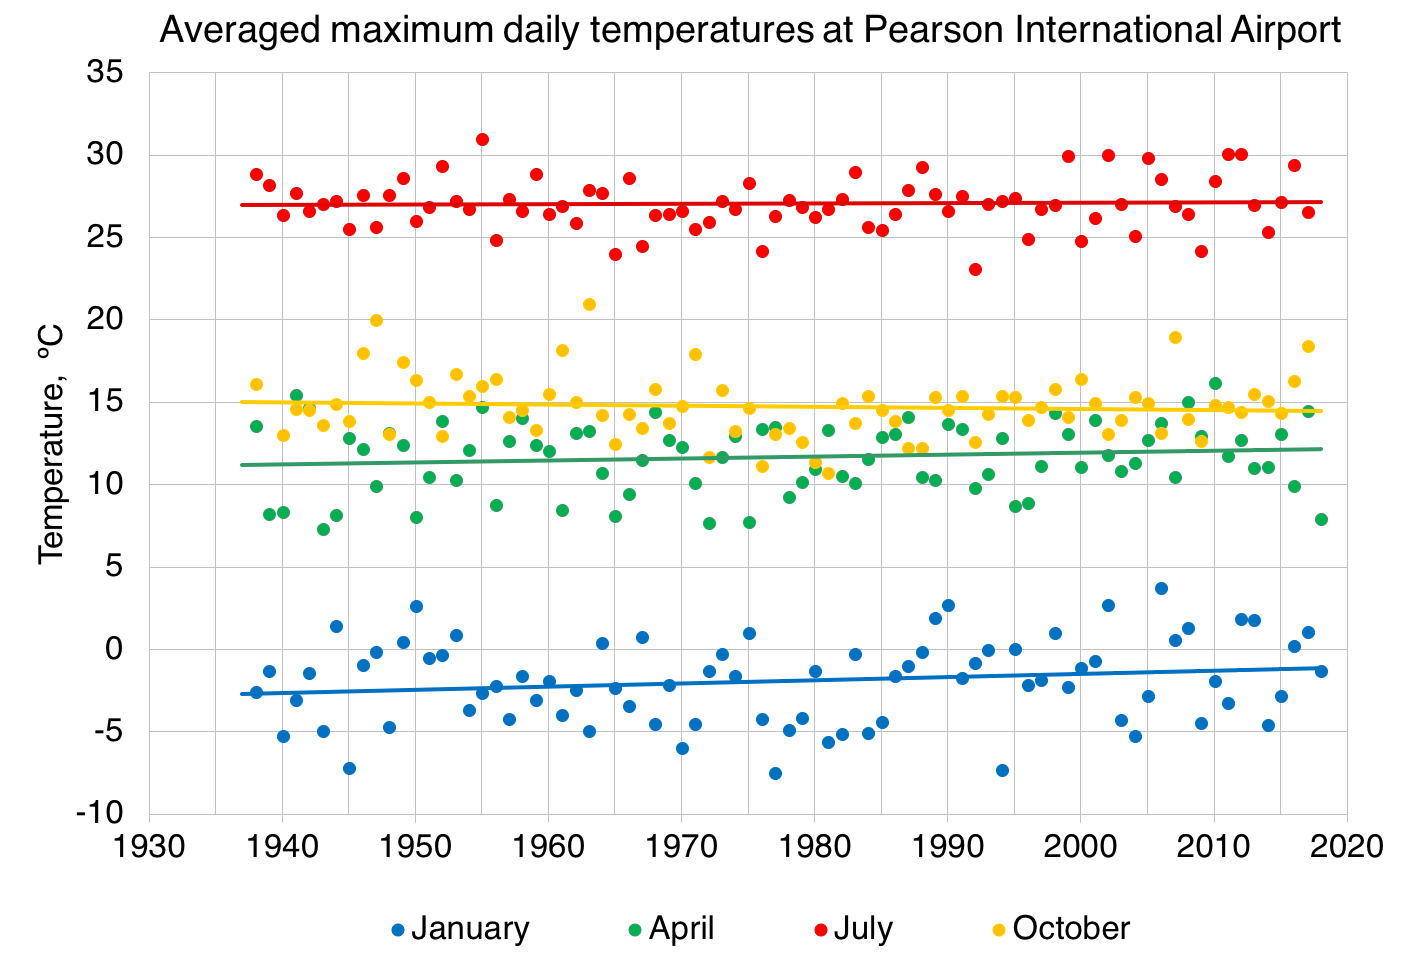
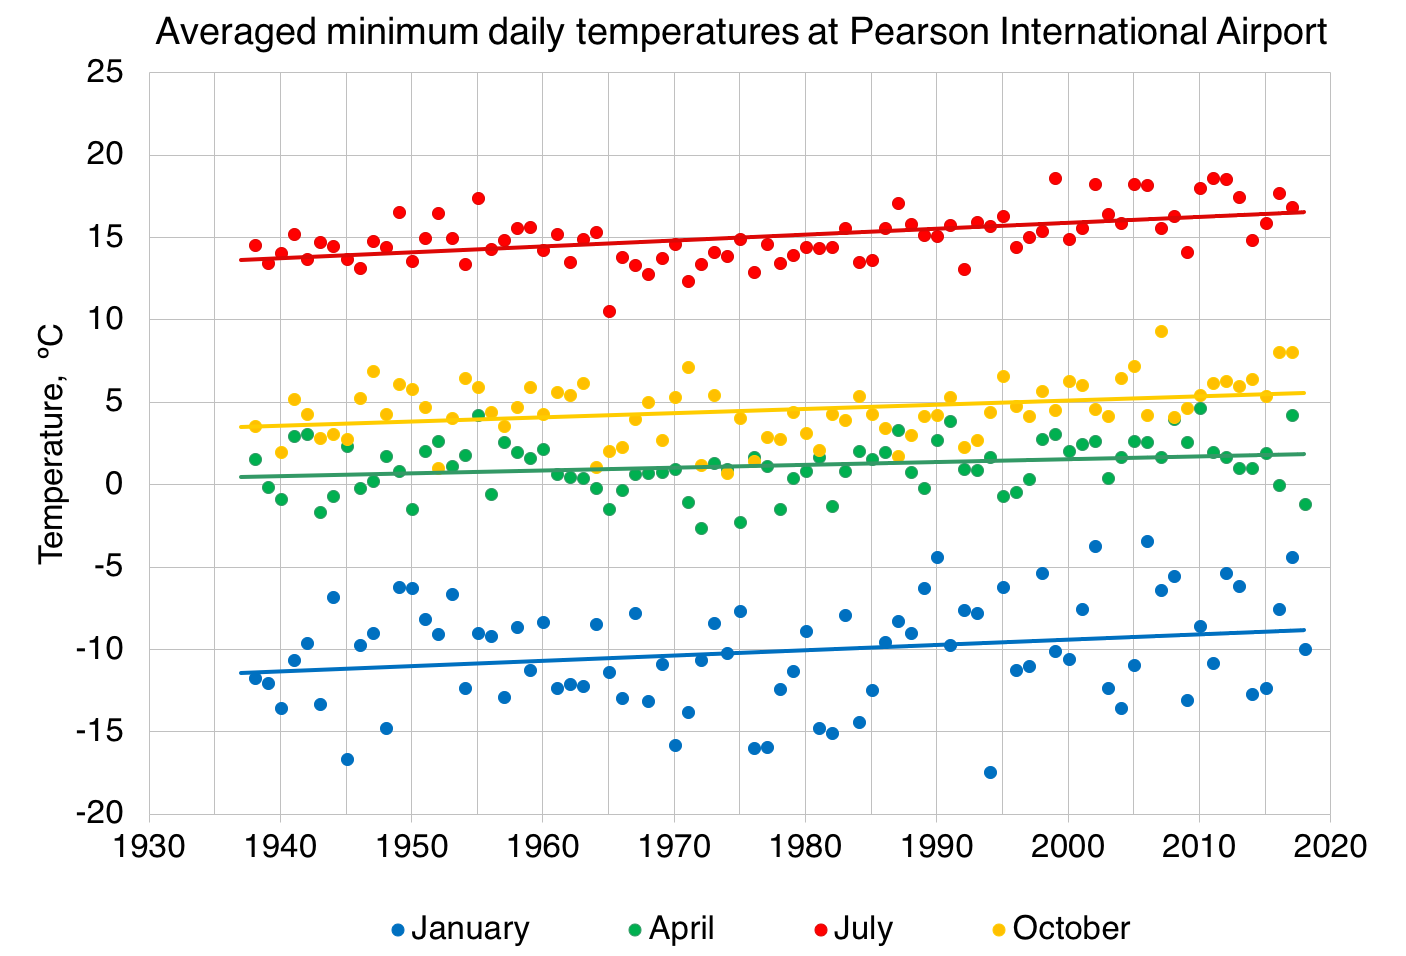
Although there are no noticeable trends for daily maxima (perhaps with the exception of January temperatures), a clear upward trend exists for daily minimum temperatures. It is clear nights have become a bit warmer.
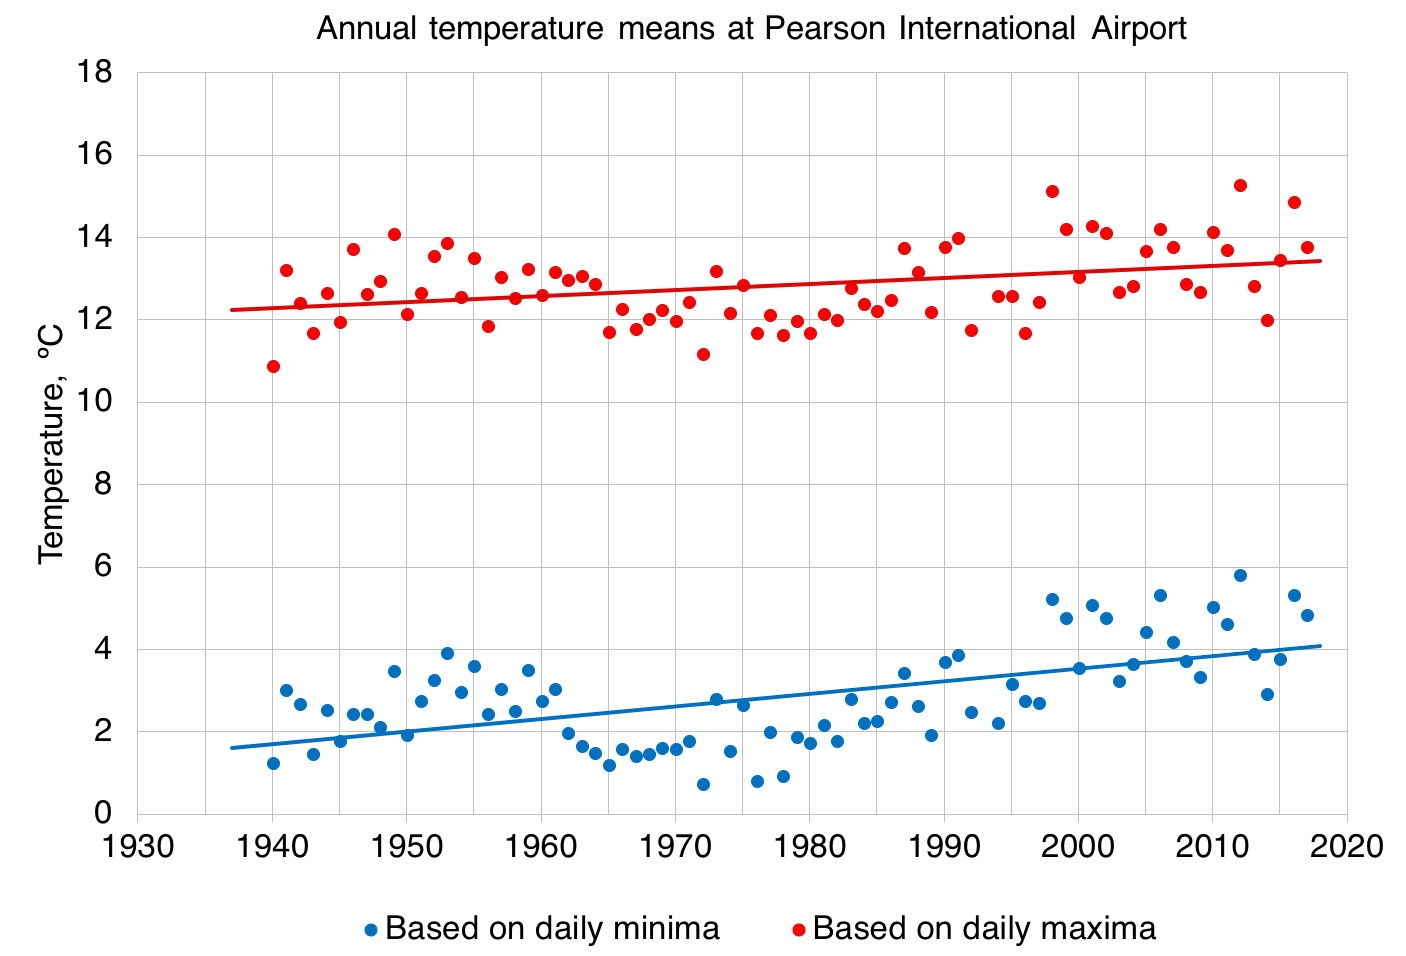
Annual means show a pattern of warming, which is especially prominent after the cold temperatures of the 60s and 70s:
Temperature “volatility”
Average temperatues are not the only factor affecting a person’s comfort level with a particular climate. Whenever someone complains about “crazy weather”, they mean day-to-day variation. Let’s take a look at standard deviations of day-to-day changes in temperature.
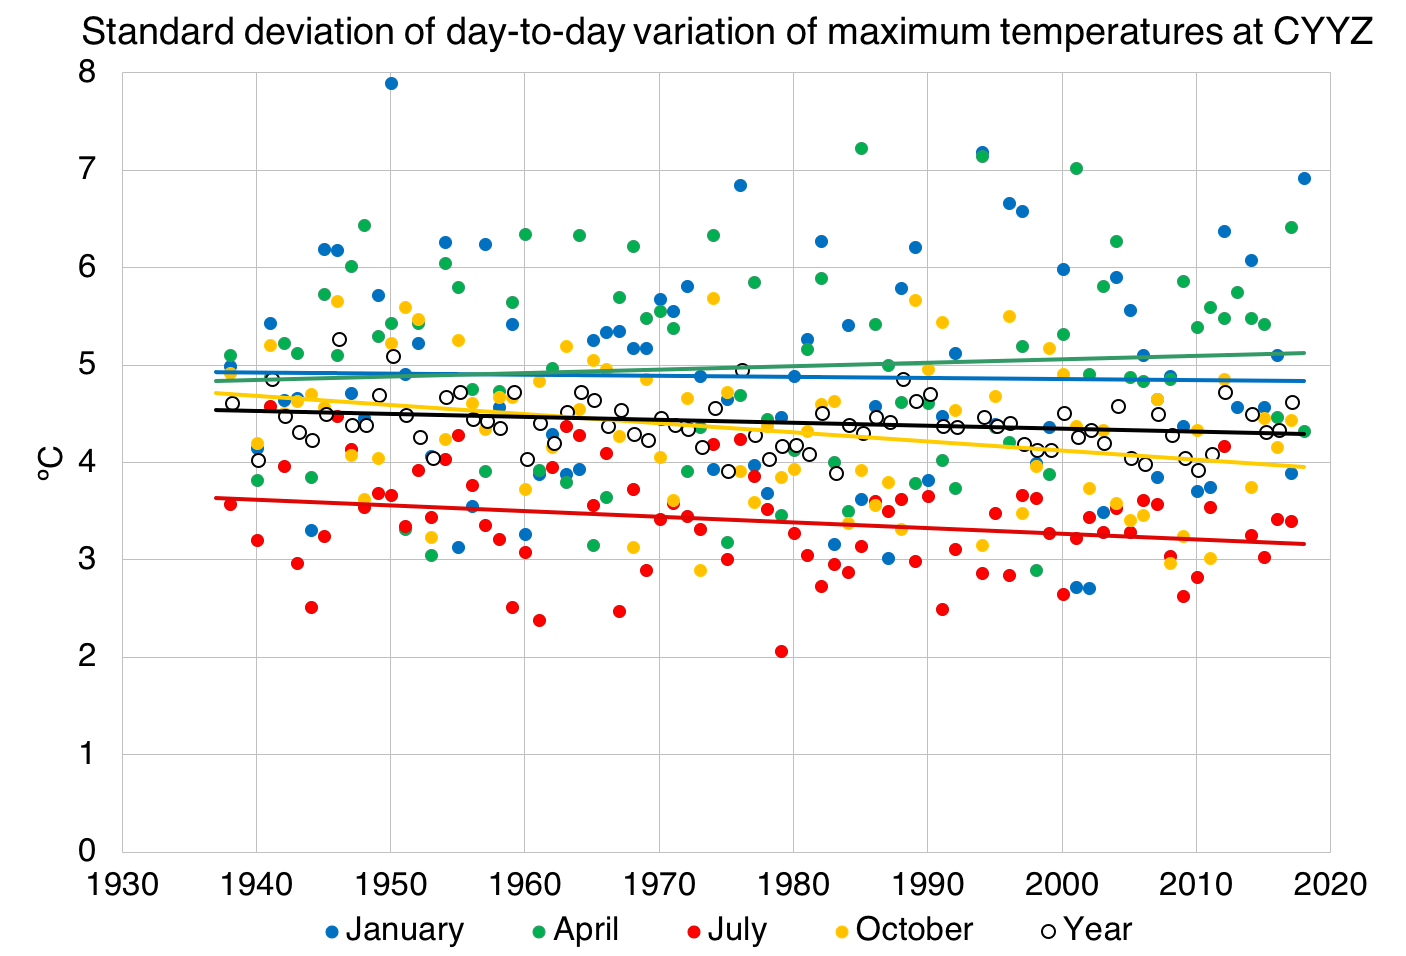
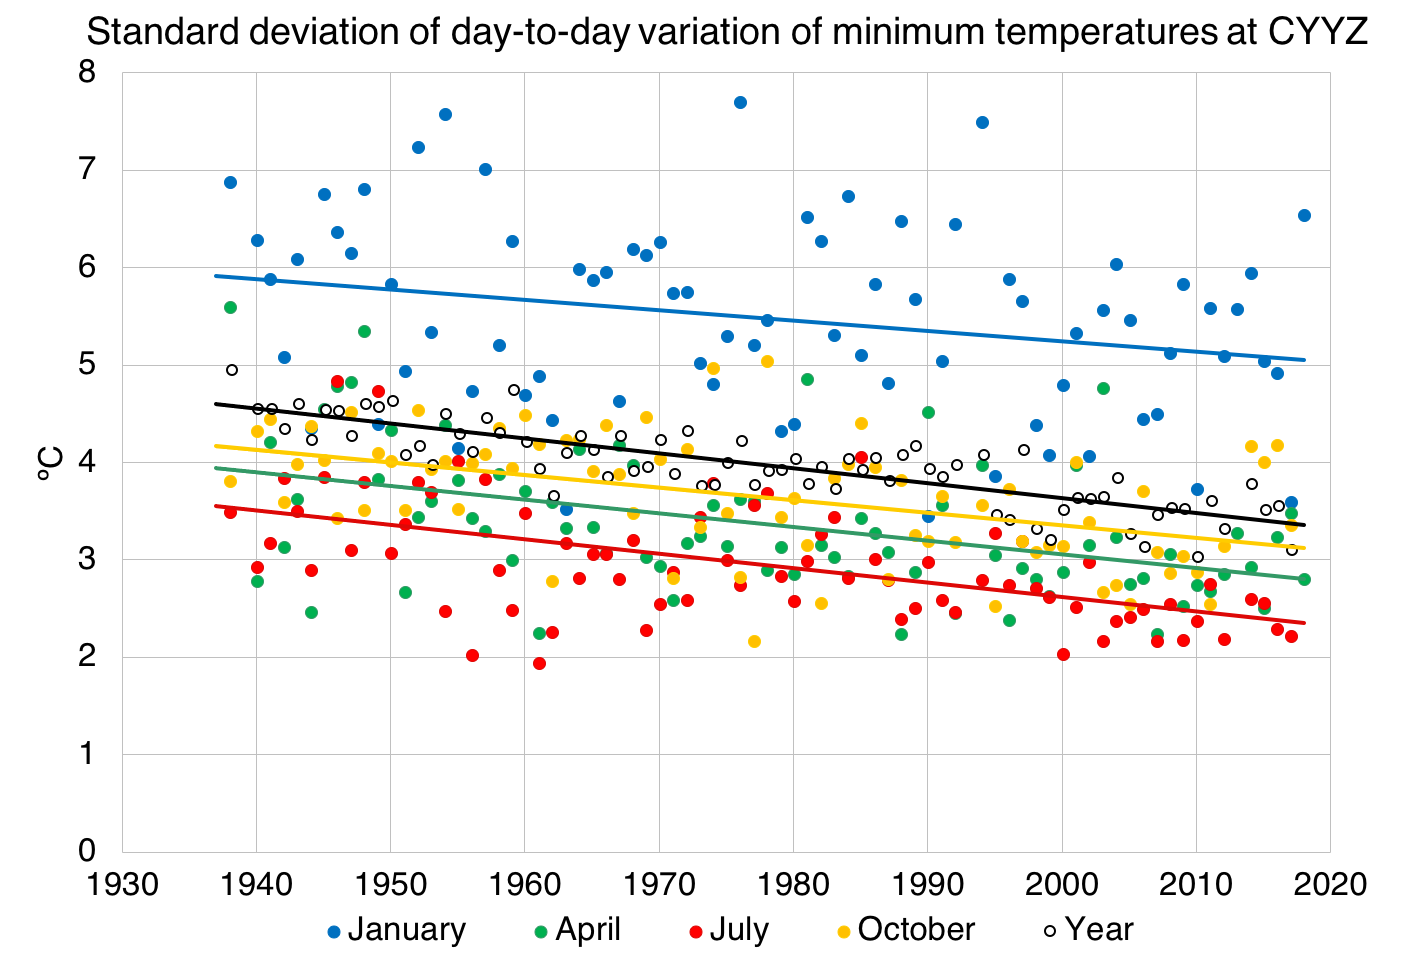
The plots look surprising to me. With increasing average temperatures I expected to see more volatility. Yet daily minima have become more consistent than in the past.